Welcome to Vitaminise Data Analytics
Vitaminise Data Analytics is a data visualization solution for insurance companies. Capture and analyze data ingested from Vitaminise Mobile App, Chatbot, Web Portal, and Customer Feedback Tool to track metrics on sales, claims, and customers. With this information, you will be able to optimize your up/cross-selling strategies and understand where most of your sales and marketing efforts should be targeted.
Contact us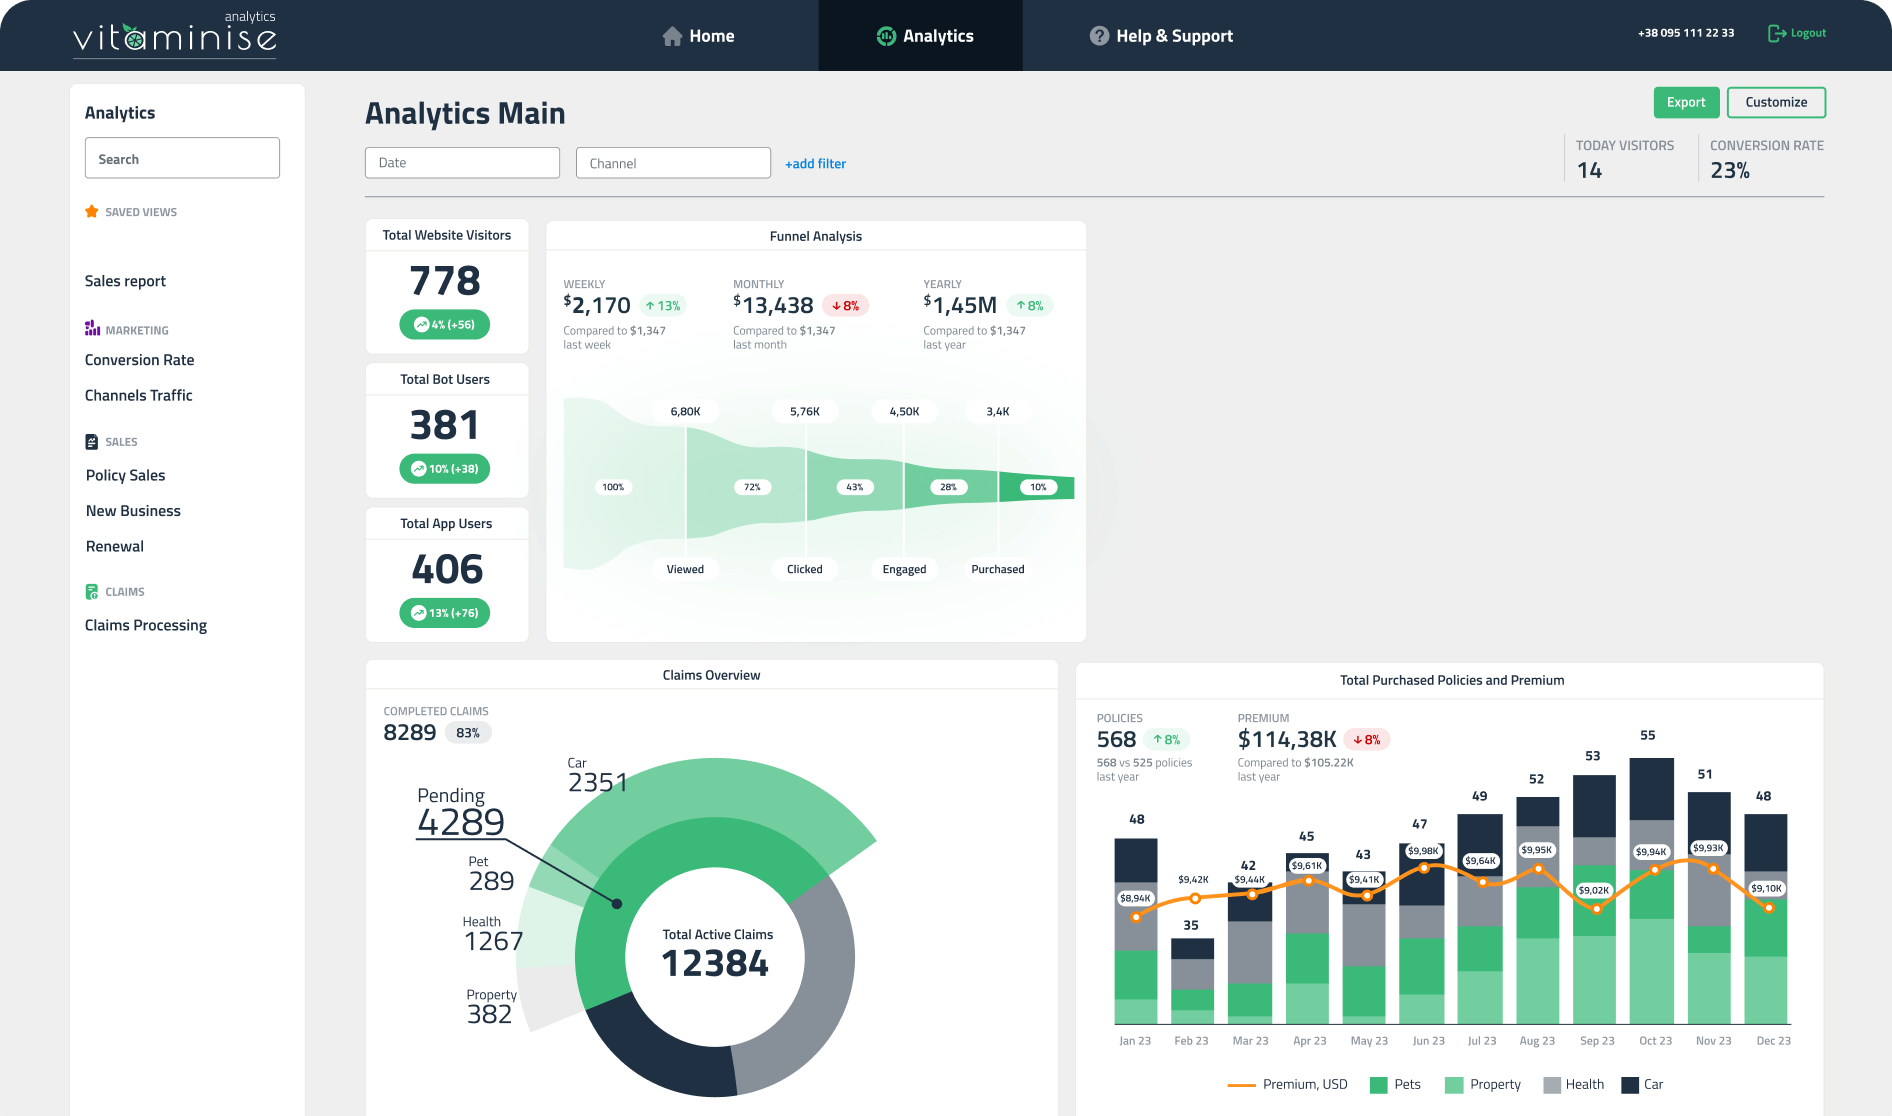
Analytics Main